Add color markers in Excel: highlight key data. 1 click. Optipe DTS → Visual!
Color Markers application of Optipe Data Tools Suite adds color marks according to numerical data ranges for better visualization of the data.

 Use this application to:
- Mark in red or blue evaluations of students in a course.
- Rank in red, yellow or green your sales or production.
- Paint or fill the cells with a color depending on its value.
- This application was initially created for Excel 2003, where conditional formats were complex to administer.
Features:
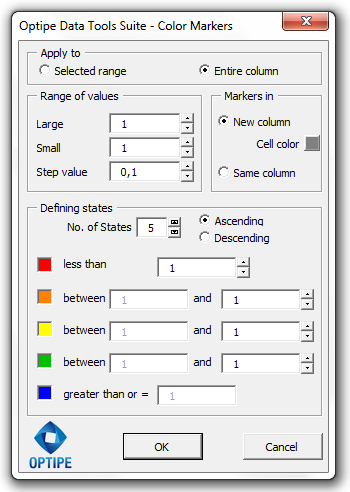
- The markers are added in a new column adjacent to the column in which the data are in the form of a LED or light. Alternatively, you can fill the cells where the data is located in the same colors.
- 2 to 5 categories are allowed, each with its own color.
- 2 states: red and blue
- 3 states: red, yellow and green
- 4 states: red, yellow, green and blue
- 5 states: red, orange, yellow, green and blue
- You define the range of values for category.
- You can change the color order (ascending or descending).
See also:
Examples:
Video Example. Add color markers in a new column.
Video Example. Add color markers in the same column.


