— What should next year's budget look like?
Once we have estimated how the current year is likely to end, a new question immediately appears.
How do we build next year's budget?
This question usually arises months before the current year has actually finished.
Companies, universities, schools, hospitals and many other organizations need to start preparing their budgets well in advance.
And the situation is usually very similar.
You have several years of historical information.
You have a current budget.
You understand how revenues and expenses have been evolving.
Yet answering a seemingly simple question remains surprisingly difficult:
How much should we budget for next year?
The answer rarely comes from a single formula.
And it is almost never as simple as copying last year's budget and applying a blanket percentage increase.
Building budgets based on intuition or simply repeating last year's numbers ❌
Using historical data, trends and business knowledge ✅
That is exactly what the model presented in this article is designed to do.
Budgeting and forecasting combine data, experience and professional judgment. In this series of articles you will find practical methods, examples and best practices designed to support planning, management control and decision-making.
💡 Key Idea: A budget is not an exact prediction of the future. It is a tool that helps organizations make better decisions.
Starting with a Year-End Forecast
Before building next year's budget, we need a reasonable estimate of how the current year is likely to end.
For that reason, this article uses the methodology described in our previous article on year-end forecasting as a starting point.
In that model we estimated year-end results using historical data, annual factors, trends and weighted forecasts.
The resulting forecast now becomes one of the most important inputs for building the budget for the following year.
✅ In other words: first we estimate how the current year will end, then we use that information to build next year's budget.
Four Methods for Estimating Future Growth
The model presented in this article calculates several growth estimates using historical data from multiple years.
Each method contributes a different perspective.
And, just as in the previous article, the final recommendation is obtained by combining several estimates rather than relying on a single forecasting approach.
📊 Method 1: Average
The first method calculates the average growth rate observed during the historical period.
It is probably the simplest estimate to build and explain.
The logic behind this method is straightforward:
Advantage: Very easy to understand and explain.
Limitation: May be influenced by unusually high or low periods.
📈 Method 2: Weighted Average
This method assigns more importance to recent growth rates.
In many situations it makes sense to give more weight to recent years than to older periods.
For example:
- 2023 = 15%
- 2024 = 25%
- 2025 = 60%
Advantage: Responds better to recent changes.
Limitation: May place too much emphasis on temporary situations.
📉 Method 3: Linear Trend
This method applies a linear trend to historical growth rates.
The objective is to identify the general direction that growth has followed over time.
Advantage: Identifies upward and downward trends.
Limitation: Can produce extreme estimates when historical variations are significant.
📚 Method 4: CAGR
CAGR (Compound Annual Growth Rate) estimates a single annual growth rate that represents the entire historical period.
Unlike a simple average, CAGR incorporates the cumulative effect of growth over time.
Advantage: Provides an excellent representation of long-term growth.
Limitation: May hide important fluctuations that occurred between years.
⭐ Recommended Growth Rate
None of the previous methods is perfect.
Each one provides a different perspective on future growth.
For that reason, the model combines all four estimates using configurable weights.
In this example we use:
- Average = 30%
- Weighted Average = 30%
- Linear Trend = 20%
- CAGR = 20%
Weights may be adjusted individually for each account when historical behavior suggests that a different balance is more appropriate.
This flexibility allows the model to be adapted to very different situations across revenues, payroll, facilities, professional services and other budget categories.
📌 Important
More sophisticated methodologies exist, including statistical models, exponential smoothing, ETS forecasting, ARIMA and other advanced techniques.
However, in many organizations the simple methods presented in this article deliver results that are sufficiently accurate while remaining easy to understand, maintain and explain.
The goal is not to find the perfect mathematical model. The goal is to create a practical and defensible budget that supports decision-making.
📝 Practical Example: Building Next Year's Budget
In this example we use three years of historical results together with the forecasted year-end result for the current year.
Using that information, the model calculates annual growth factors, growth estimates and a recommended growth rate for each budget account.
We then apply growth limits and business drivers to incorporate information that historical data alone cannot capture.
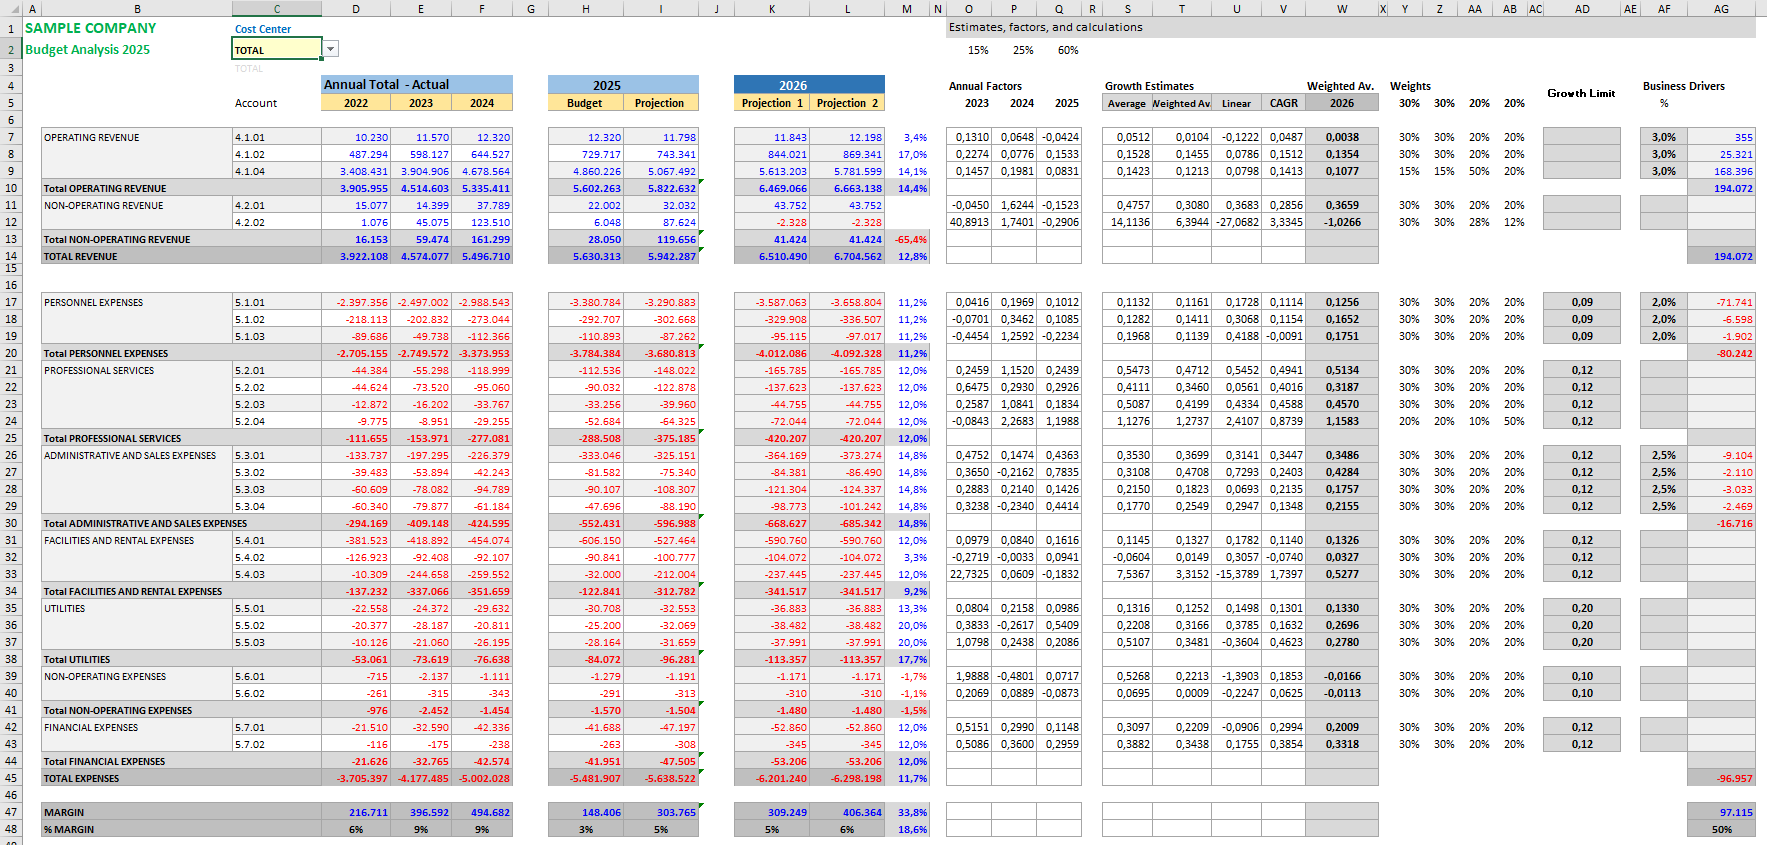
Budget forecasting model combining historical growth rates, CAGR, growth limits and business drivers to build next year's budget.
Notice that the model first produces a technical forecast based entirely on historical data.
It then incorporates business knowledge that allows specific accounts to be adjusted when future circumstances are known in advance.
💡 Key Idea: Historical data explains the past. Business Drivers represent what the organization already knows about the future but which is not yet visible in the available data.
💻 Excel Implementation
The good news is that you do not need specialized software to build this forecasting model.
Excel contains all the functions required to implement every step described in this article.
💡 Practical Experience: In most organizations, the most useful models are not necessarily the most sophisticated. They are the ones that can be understood, maintained and adjusted over time.
1. Annual Factors (Columns O:Q)
The first step is to calculate the growth rates observed between historical years and the forecasted year-end result.
[P7] = IFERROR((F7/E7)-1,0)
[Q7] = IFERROR((I7/F7)-1,0)
These growth rates provide the foundation for every forecasting method used in the model.
2. Average Growth Estimate (Column S)
Calculates the average growth rate observed across the available periods.
3. Weighted Average Estimate (Column T)
Assigns greater importance to recent growth rates.
4. Linear Trend Estimate (Column U)
Applies a linear trend to historical growth rates.
5. CAGR - Compound Annual Growth Rate (Column V)
CAGR estimates a single annual growth rate representing the entire period.
6. Recommended Growth Rate (Column W)
The four estimates are combined into a single recommended growth rate.
Weights may be adjusted individually for specific accounts when required.
7. Growth Limits (Column AD)
One of the most common challenges in budgeting occurs when certain historical variations generate growth projections that are technically correct but difficult to justify in practice.
To address this issue, the model incorporates account-level growth limits.
💡 Important: Growth limits reflect the specific characteristics of each account or account group, internal budgeting policies, external regulations and the practical experience of budget managers.
8. Technical Forecast (Column K)
The Technical Forecast represents the result generated exclusively from historical data and forecasting methods.
If a growth limit exists, the model uses the lower value between the calculated growth rate and the limit.
9. Business Drivers (Columns AE:AF)
Historical data explains what happened in the past.
However, organizations often possess information about future events that does not yet appear in the available data.
Examples include:
- New academic programs.
- Expected enrollment growth.
- New business contracts.
- New facilities or locations.
- Regulatory changes.
- Strategic initiatives.
💡 Key Idea: Historical data explains the past. Business Drivers represent what the organization already knows about the future.
10. Adjusted Budget (Column L)
Finally, Business Drivers are applied to the Technical Forecast to produce the recommended budget.
This adjusted budget combines:
- Historical information.
- Forecasting methods.
- Professional judgment.
- Business knowledge.
📈 A Budget Is Not a Formula
Many people look for formulas capable of automatically generating a budget.
In practice, the most useful budgets combine quantitative analysis with business knowledge.
Models help.
But no formula can completely replace the experience of people who understand the organization and its environment.
✅ Best Practices
📚 Use Historical Data
Use at least two or three years of historical information whenever possible.
📊 Combine Methods
Avoid relying on a single estimate. Different methods provide complementary perspectives.
🚦 Define Growth Limits
Growth limits help prevent unrealistic projections caused by exceptional historical situations.
💼 Incorporate Business Drivers
Combine historical analysis with information that your organization already knows about the future.
❌ Common Mistakes
- Repeating last year's budget without analysis.
- Ignoring known future changes.
- Applying the same growth rate to every account.
- Failing to review extreme results.
- Depending exclusively on statistical methods.
- Treating forecasts as exact predictions.
❓ Frequently Asked Questions
What is the best budgeting method?
There is no single best method. Combining multiple approaches generally produces more reliable results.
Why use CAGR?
CAGR provides a single annual growth rate for the entire period under analysis.
Why use Growth Limits?
They help prevent unrealistic forecasts caused by exceptional data points.
Are Business Drivers necessary?
Not always, but they often include valuable information unavailable in historical data.
Can method weights be changed?
Yes. One of the strengths of the model is its flexibility at the account level.
📚 Related Articles
- How to Forecast Year-End Results and Anticipate Budget Variances.
- Coming Soon - How to Build Budget Scenarios.
- Coming Soon - Forecasting Revenues Using Historical Data.
- Coming Soon - Forecasting Expenses Using Historical Data.
- Coming Soon - Allocating Budgets Across Departments and Cost Centers.
Tools born from real-world challenges
Many budgeting, reporting, data analysis and information consolidation tasks are repetitive and consume a significant amount of time. Tools such as Data Tools Suite and MultiMail were developed to help automate these activities and allow professionals to focus more on analysis and decision-making.
🚀 Explore Data Tools Suite 📧 Explore MultiMail
TRY IT. YOU'LL GET IT.
