Unpivoting Excel columns allows you to transform matrix-style reports into structured databases ready for Power BI, PivotTables, dashboards and business intelligence processes. It is one of the most effective techniques for converting static reporting formats into data models suitable for analysis.
Many reports are built with months, periods, products or categories distributed across multiple columns. While this layout works well for visual reading, it becomes difficult to use for advanced reporting, data consolidation, trend analysis and business intelligence projects.
Imagine this situation: you receive a sales report where January, February, March and the rest of the year are displayed as separate columns. Before building dashboards or KPIs, you must first transform that matrix into a normalized dataset.
Work with complex matrix reports full of columns? ❌
Transform them into an analysis-ready database? ✅
Solve it in 2 clicks directly inside Excel. Forget broken formulas, manual errors, or endless prompts: Data Tools Suite automates table merging, splitting sheets, comparing lists, and cleaning data so you can focus on real analysis.
TRY IT. YOU'LL GET IT.
1-minute setup • No registration required • Fully functional
📋 When Unpivoting Columns Creates Business Value
Power BI
Prepare datasets for dashboards and analytical models.
KPIs & Reporting
Build indicators and reports using normalized data.
Sales & Budgets
Transform monthly reports into consolidated analytical datasets.
Management Control
Prepare corporate data for monitoring and decision-making.
⚡ Transform Report Matrices into Analysis-Ready Databases
The Unpivot Columns application automatically converts tables where information is distributed across multiple columns into a normalized database structure.
This transformation dramatically simplifies subsequent work with PivotTables, Power BI, dashboards, KPIs and business analysis tools.
The result is a flexible data structure ready for reporting, consolidation and data modeling.
🔴 Traditional Method
- Work with difficult-to-analyze matrices.
- Create complex formulas.
- Restructure reports manually.
- Adapt data for each reporting need.
- Repeat the process whenever new reports arrive.
🟢 With Unpivot Columns
- Convert matrices into structured databases.
- Prepare information for BI tools.
- Simplify reporting and consolidation.
- Reduce manual work.
- Work with normalized data structures.
📝 Example: Converting a Monthly Report into a Database
Imagine a table where each month appears as a separate column across the report.
This format may be convenient for viewing, but it becomes difficult to use for dashboards, KPIs, consolidations and data analysis.
The application transforms the structure into a table where each period becomes an individual record, producing a dataset ready for Power BI and business intelligence platforms.
💡 Note: This technique is especially useful for sales reports, budgets, KPIs, inventory reports, statistics and financial planning models.
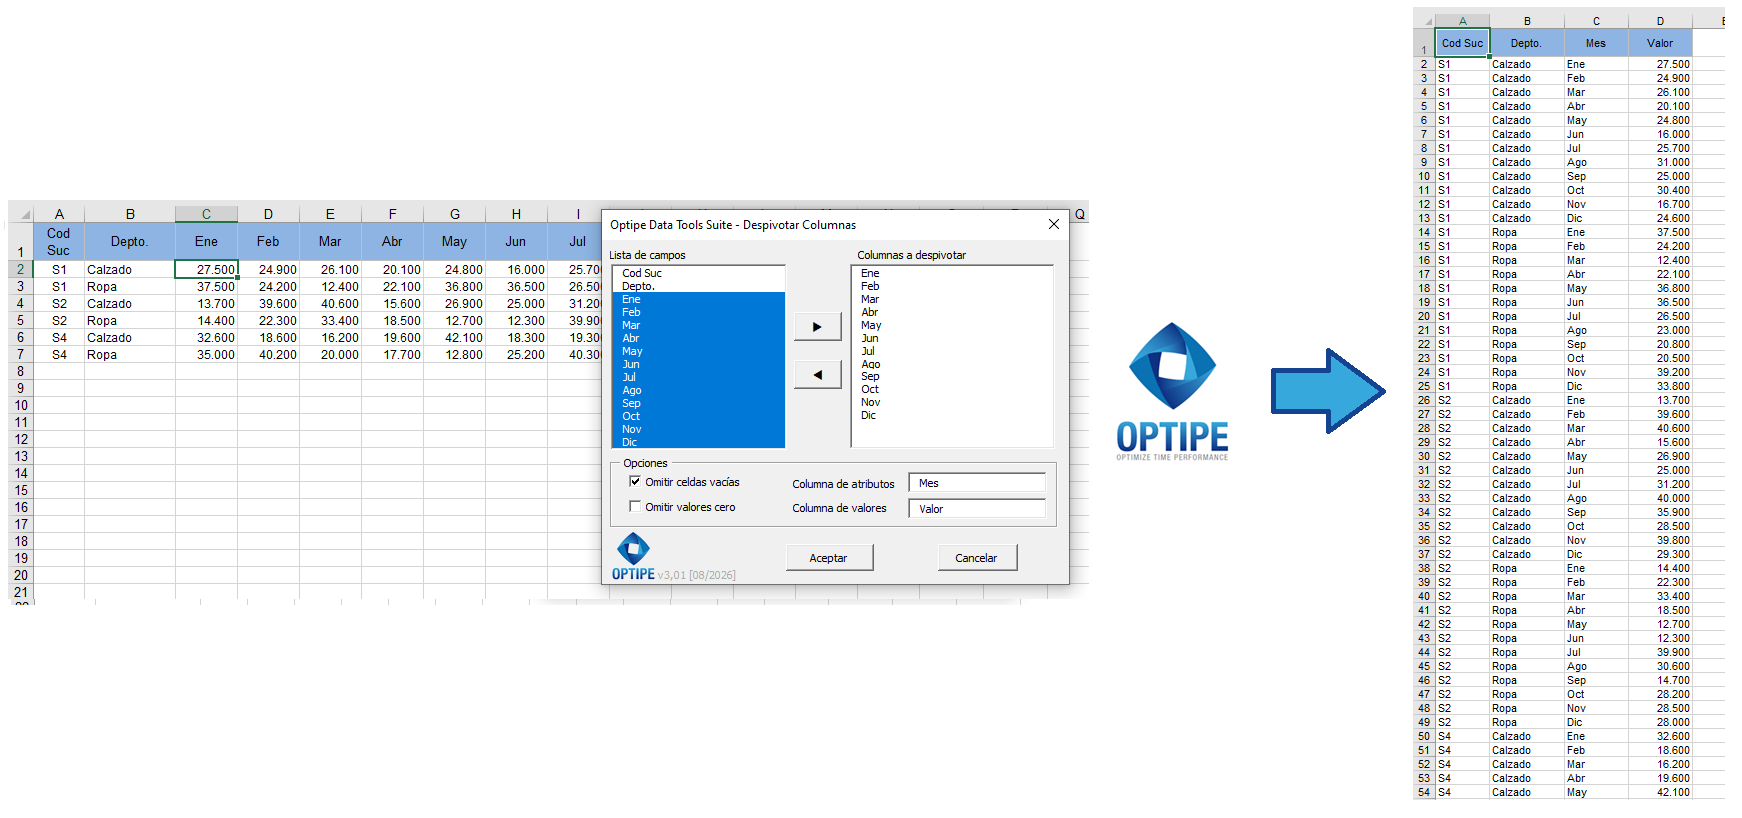
Columns containing periods or categories can be automatically transformed into records ready for analysis.
💡 Result
The information becomes organized in a normalized structure ready for reporting, dashboards and business analysis.
🚀 Much More Than Simply Unpivoting Columns
Unpivot Columns does more than transform matrices into tables. It helps prepare data for Power BI, dashboards, KPIs, reporting systems, and business intelligence environments.
- ✔ Convert matrix reports into normalized databases.
- ✔ Prepare data for Power BI and BI platforms.
- ✔ Simplify PivotTable creation.
- ✔ Reduce manual data transformation work.
- ✔ Improve analytical consistency and reporting quality.
- ✔ Prepare information for consolidation and advanced analysis.
🎥 Video: Unpivot Excel Columns Automatically
Learn how to transform two-dimensional report structures into normalized databases ready for analytics and business intelligence.
📌 Practical Use Cases Where Unpivoting Creates Value
📊 Monthly Sales Reports
Transform reports containing months as columns into datasets suitable for trend analysis and reporting.
💰 Budget Models
Convert budgeting matrices into structured datasets for consolidation and financial planning.
📈 Business Intelligence
Prepare information for Power BI, dashboards, reports and decision-support systems.
🏢 Management Control
Build KPI systems and operational reports using normalized data structures.
💡 From Matrix Reports to Analysis-Ready Information
Many reports are designed for human reading rather than data analysis. Unpivoting bridges that gap by reorganizing the information into a structured format.
- Step 1: Receive data in matrix format.
- Step 2: Unpivot period or category columns.
- Step 3: Generate a normalized database.
- Step 4: Build reports, dashboards and analytics.
This transformation dramatically increases the usefulness of business data across reporting and analytical processes.
📚 Tip: Continue with Data Cleaning and Preparation
💡 Next Step: After unpivoting a dataset, most users continue by cleaning, preparing, or transforming the information before creating dashboards and management reports.
👉 Clean and Prepare Data in Excel Quickly
👉 Increase or Decrease Thousands of Prices and Values in Excel
⏱ Comparison: Traditional Method vs. Unpivot Columns
| Traditional Method | Unpivot Columns |
|---|---|
| Manually restructure report matrices. | Automatic transformation. |
| Repeated report modifications. | Create an analysis-ready database in one process. |
| Greater error risk. | Consistent and repeatable results. |
| Limited BI compatibility. | Power BI and dashboard ready. |
| Time-consuming preparation effort. | Fast and scalable data preparation. |
❓ Frequently Asked Questions
What does unpivoting columns mean?
It means transforming columns representing categories or periods into individual records within a normalized database structure.
Is this similar to the Unpivot feature in Power Query?
Yes. The objective is the same: converting matrix-style reports into analysis-ready datasets.
Can I use the resulting data in Power BI?
Absolutely. Power BI is one of the main use cases for unpivoted datasets.
Can empty values or zeros be excluded?
Yes. The application allows null or zero values to be omitted during transformation.
Does it work with financial reports and budgets?
Yes. It is especially useful for sales, budgets, KPI reports, forecasts and management analysis.
Does my data leave my computer?
No. All processing takes place locally.
📚 Related Articles
Automate your Excel work and save hours every week
Data Tools Suite includes 18 applications to automate data management, tables and worksheets in Excel.
MultiMail lets you send personalized emails, documents and reports directly from Excel.
TRY IT. YOU'LL GET IT.
🚀 Download Freemium Version