Reconciling data in Excel helps identify discrepancies, value differences, and missing records between reports, databases, or business systems. It is a common task in finance, controlling, audit, inventory management, and report validation processes. As datasets grow, so do the risks of errors, omissions, and the time required to validate information.
Consider this situation: you receive two monthly reports. Both contain sales information by branch, department, and reporting period. You need to determine which records match, which contain differences, and which are missing from the other report.
Review reports line by line manually? ❌
Reconcile data and detect discrepancies automatically? ✅
Still doing this manually? Merging tables, comparing lists, cleaning data, and consolidating files can take hours each week. Data Tools Suite automates repetitive tasks in 2 clicks inside Excel—no complex formulas or endless prompts—so you can spend your time analyzing.
TRY IT. YOU'LL GET IT.
📋 Common situations where data reconciliation is critical
Budgets
Compare budgets against actual results and identify significant variances.
Inventory
Validate differences between physical inventory and system records.
Reporting
Reconcile information exported from multiple systems and departments.
Audit
Detect inconsistencies and validate data integrity.
Want to reconcile data and detect discrepancies without formulas? Discover the Compare Lists App →
⚡ Much more than simply comparing lists
In reconciliation processes, it is not enough to know whether a record exists. You also need to determine whether the associated values are correct.
For example, a sales record may exist in both reports but contain different amounts. In that scenario, the real issue is not record existence, but the discrepancy identified.
The Compare Lists application can compare records using up to three matching criteria, validate amounts or quantities, and automatically calculate the differences found.
🔴 Traditional Method
- VLOOKUP or XLOOKUP.
- Helper formulas.
- Manual value comparison.
- Manual discrepancy review.
- High risk of missing exceptions.
🟢 With Compare Lists
- Comparison using up to 3 criteria.
- Automatic status classification.
- Built-in discrepancy detection.
- Automatic difference calculation.
- Ready-to-analyze results.
📝 Example: Reconcile two reports and detect differences
Suppose you have two sales reports exported from different systems. Both contain information by branch, department, and reporting period.
The application compares every record using the selected criteria and automatically classifies the reconciliation result.
💡 Note: In this example, records are matched using three simultaneous criteria: branch, department, and reporting period. This type of reconciliation is common in budget control, inventory validation, and management reporting.
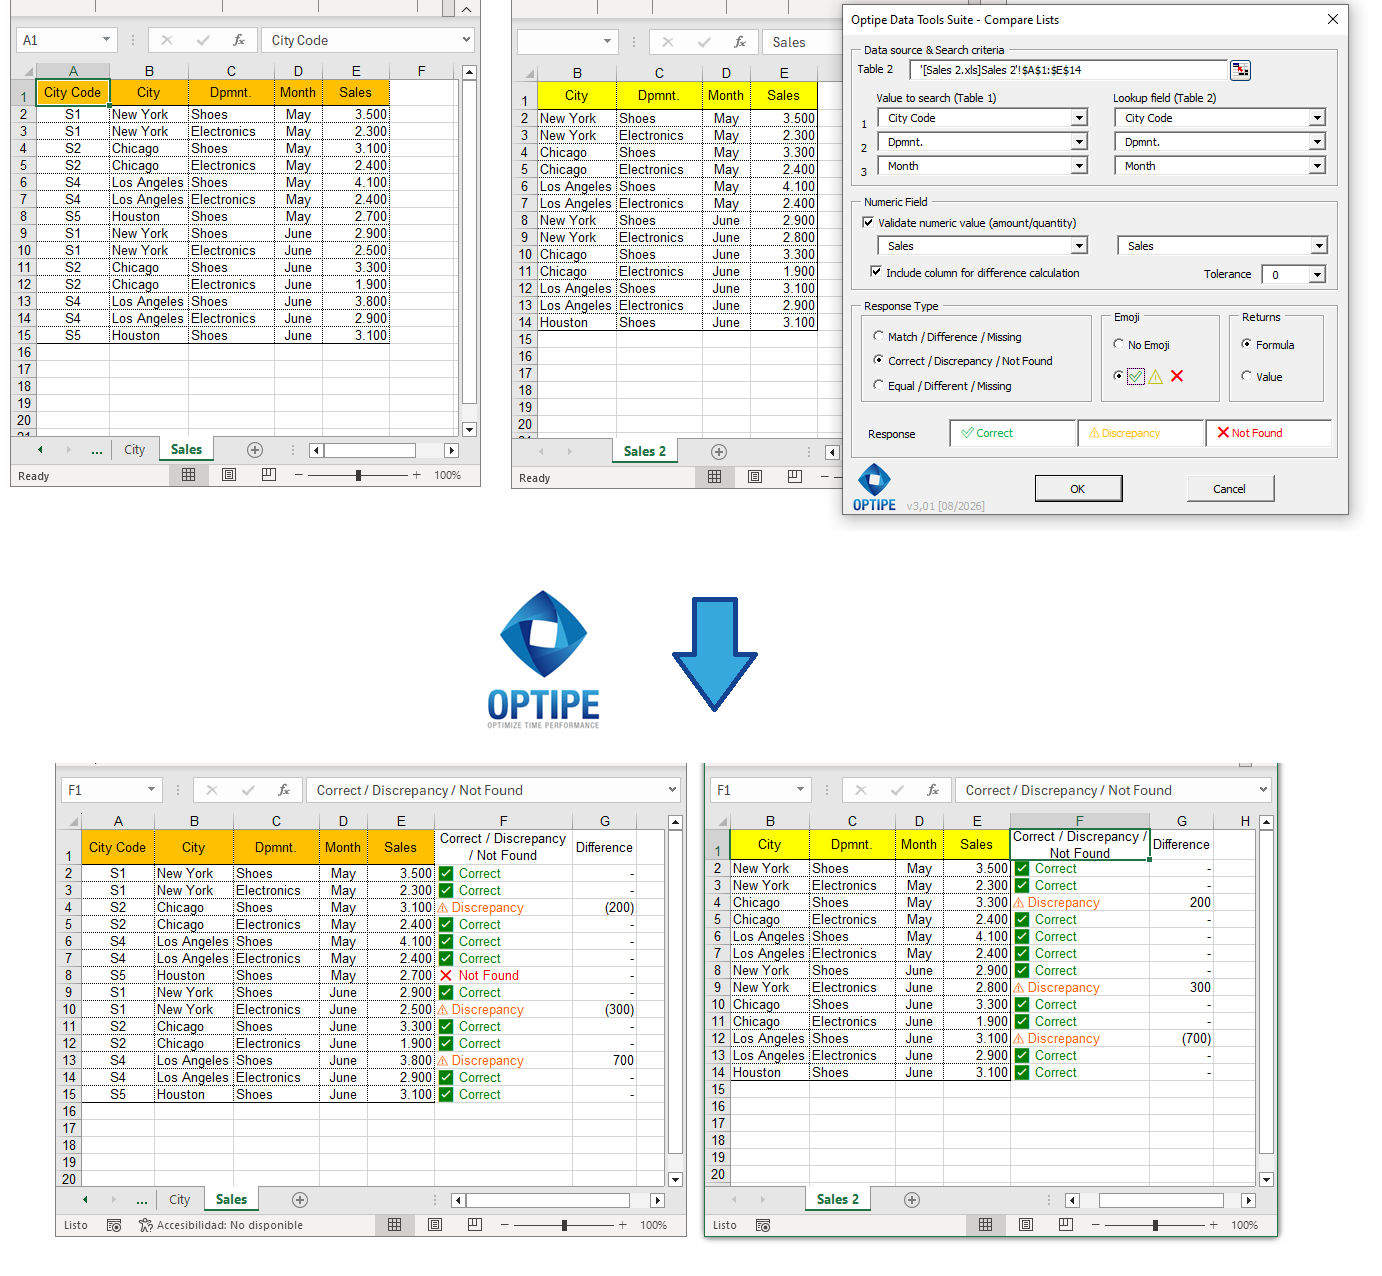
The reconciliation process automatically classifies records as Correct, Discrepancy, or Not Found.
🎥 See Compare and Reconcile Lists in action (in 40 seconds)
💡 Result
Differences are identified instantly, allowing users to focus their analysis only on records that actually require attention.
🚀 Much more than comparing records
Data reconciliation helps uncover discrepancies that often remain hidden when we only check whether records exist.
- ✔ Compare records using up to 3 matching criteria.
- ✔ Detect differences in amounts and quantities.
- ✔ Calculate variances automatically.
- ✔ Apply tolerance levels for real-world reconciliations.
- ✔ Customize reconciliation statuses.
- ✔ Focus only on records that require attention.
📌 Situations where reconciliation delivers the greatest value
💰 Budget Control
Compare budget figures against actual results and identify meaningful variances.
📦 Inventory Management
Detect differences between physical inventory and system records.
🏢 ERP Integrations
Validate exported data and reconcile information between multiple systems.
📊 Audit and Compliance
Identify inconsistencies before publishing financial or management reports.
💡 Tolerance Levels and Reconciliation Criteria
In many business reconciliations, exact equality is not always required. Rounding differences, minor adjustments, or system-specific variations can be acceptable depending on the context.
For that reason, the application includes configurable tolerance levels:
- 0: exact reconciliation.
- 1: minimal differences.
- 10: small operational variances.
- 100: summarized reconciliations.
- 1000: consolidated or high-level analysis.
This allows users to focus only on differences that truly matter.
🎨 Fully Customizable Statuses
By default, the application classifies reconciliation results using three easy-to-understand statuses:
- ✅ Correct
- ⚠️ Discrepancy
- ❌ Not Found
However, these labels can be customized to match the workflow and terminology used by your organization.
For example:
- ✅ Reconciled
- ⚠️ Review Required
- ❌ Pending
The combination of colors and emojis makes it much easier to interpret large volumes of reconciliation results.
⏱ Comparison: Manual Reconciliation vs Automated Reconciliation
| Traditional Method | Compare Lists |
|---|---|
| Manual VLOOKUP or XLOOKUP processes. | Automated reconciliation. |
| Line-by-line review. | Automatic classification. |
| Difficult discrepancy detection. | Automatic variance calculation. |
| High risk of omissions. | Consistent and repeatable process. |
❓ Frequently Asked Questions
Can I compare records using more than one criterion?
Yes. The application supports reconciliation using up to three matching criteria simultaneously.
What happens if a record exists but the value is different?
The result will be classified as a Discrepancy and the variance can be calculated automatically.
Can I customize the reconciliation statuses?
Yes. The labels used to classify results can be adapted to your organization's terminology.
Why would I use tolerance levels?
Tolerance levels help ignore insignificant differences and focus only on meaningful discrepancies.
Is this useful for financial reconciliations?
Absolutely. It is particularly useful for budgets, inventory controls, sales reporting, audits, and management reporting.
Do I need to create formulas?
No. The reconciliation process can be completed without writing complex Excel formulas.
📚 Related Articles
Automate your Excel work and save hours every week
Data Tools Suite includes 18 applications to automate data management, tables and worksheets in Excel.
MultiMail lets you send personalized emails, documents and reports directly from Excel.
TRY IT. YOU'LL GET IT.
🚀 Download Freemium Version