Creating summary tables is one of the most common tasks when working with Excel. Whether you need total sales by branch, average values by department or the number of transactions per customer, summarizing information is essential for decision making.
Many Excel users rely on PivotTables for this purpose. Although they are powerful, PivotTables are not always the most convenient solution, especially when you simply need a clean summary table that can be generated repeatedly with different criteria.
With the Extract Data application included in Data Tools Suite, you can automatically create summary tables using built-in Analysis Functions, without PivotTables, complex formulas or manual calculations.
Build PivotTables every time you need a report? ❌
Generate summary tables automatically in seconds. ✅
Still doing this manually? Merging tables, comparing lists, cleaning data, and consolidating files can take hours each week. Data Tools Suite automates repetitive tasks in 2 clicks inside Excel—no complex formulas or endless prompts—so you can spend your time analyzing.
TRY IT. YOU'LL GET IT.
🔎 How to Create Summary Tables in Excel Manually
PivotTables
PivotTables are Excel's most popular tool for summarizing data.
They require configuration and are not always the simplest option for recurring reports.
SUMIFS, COUNTIFS and AVERAGEIFS
Excel formulas can also generate summary information.
Large workbooks often require many formulas that become difficult to maintain.
Manual Reports
Some users still copy, filter and summarize data manually.
This approach is slow, repetitive and increases the risk of mistakes.
Want to extract data quickly and easily? Discover the Extract Data App →
⚡ Create Summary Tables Automatically Using Analysis Functions
Extract Data allows you to create summary tables directly from your Excel data by combining grouping fields with built-in Analysis Functions.
Simply add the fields that define the unique combinations and assign the desired Analysis Function to the numeric fields, such as Sum, Average, Count, Maximum or Minimum.
The application automatically generates a new worksheet containing a clean summary table that is ready for reporting or further analysis.
🔴 Traditional Method
- Create a PivotTable.
- Configure rows and values.
- Refresh when the data changes.
- Repeat for every new report.
🟢 Using Extract Data
- Select the source table.
- Choose grouping fields.
- Assign Analysis Functions.
- Click OK to generate the summary table automatically.
📝 Example: Create an Excel Summary Table Automatically
In this example, we'll summarize a sales table by grouping records by Branch while applying different Analysis Functions to the numeric fields.
The fields that identify each group are added to the Extraction section without an Analysis Function. Then, for the numeric columns, we assign the desired function, such as Sum, Count, Average, Maximum or Minimum.
After clicking OK, Extract Data automatically creates a new worksheet containing a clean summary table with one row per unique combination and the calculated values for each selected field.
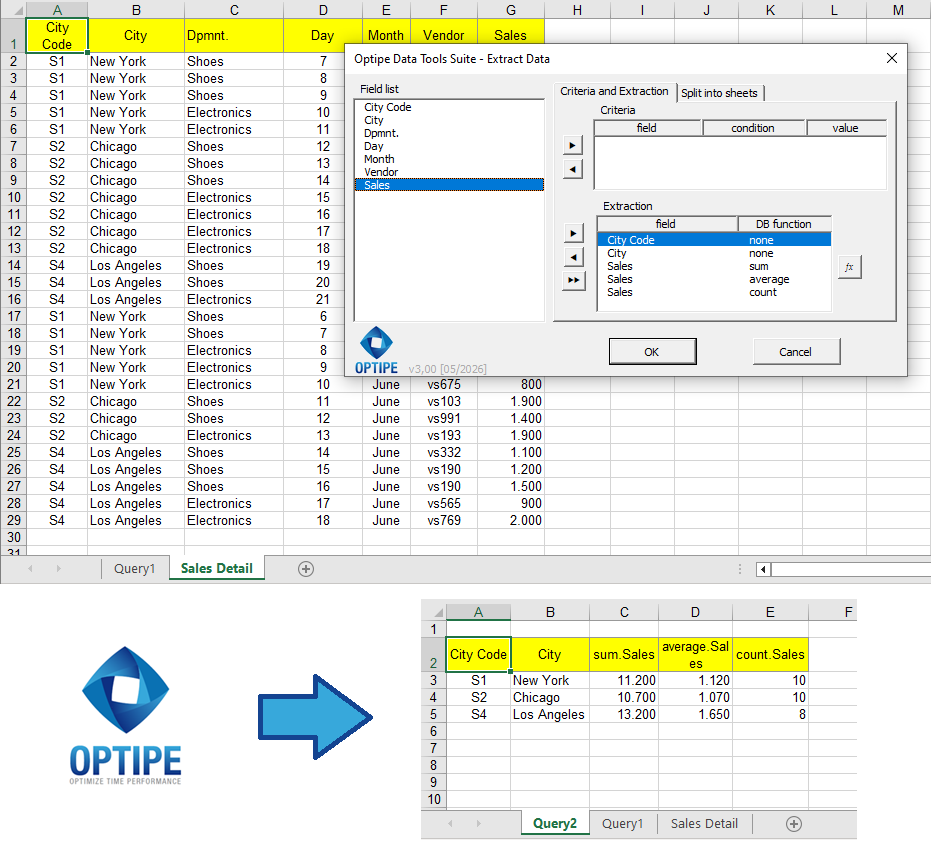
Analysis Functions automatically calculate summaries for every unique combination of the selected fields.
💡 Result
Within seconds you obtain a professional summary table that can be used for reports, dashboards or further analysis, without creating PivotTables or maintaining complex formulas.
🚀 Extract Data Does Much More Than Create Summary Tables
The application automates several common Excel data extraction tasks beyond summary tables.
- ✔ Extract unique records.
- ✔ Create summary tables using Analysis Functions.
- ✔ Extract records matching one or more criteria.
🎥 See Extract Data in action
📌 Practical Uses for Summary Tables
Automatically generated summary tables are useful in many business scenarios.
💰 Sales Reports
Summarize sales by branch, region or salesperson.
📦 Inventory Analysis
Calculate quantities, averages or totals by product category.
👥 Customer Statistics
Count customers, orders or transactions by different criteria.
📊 Management Reports
Generate recurring summary reports without rebuilding PivotTables.
❓ Frequently Asked Questions
Does this create a PivotTable?
No. Extract Data creates a standard Excel table containing summarized information, making it easier to edit, format and reuse.
Which Analysis Functions are available?
You can use Sum, Count, Average, Maximum and Minimum, depending on the type of information you want to summarize.
Can I summarize data by multiple fields?
Yes. You can group records by one or several fields before applying the Analysis Functions.
Does the original data change?
No. The original worksheet remains unchanged while the summary is generated on a new worksheet.
Can I continue working with the generated table?
Absolutely. The summary table is a regular Excel table that can be formatted, filtered, charted or exported like any other worksheet.
📚 Related Articles
These articles will help you automate additional Excel data extraction tasks.
Automate your Excel work and save hours every week
Data Tools Suite includes 18 applications to automate data management, tables and worksheets in Excel.
MultiMail lets you send personalized emails, documents and reports directly from Excel.
TRY IT. YOU'LL GET IT.
🚀 Download Freemium Version