When working with large datasets, we rarely need every record. Most of the time we are looking for specific information: sales above a certain amount, records within a range, or text values matching a particular pattern.
Although Excel includes filtering tools, repeatedly applying different criteria can become time-consuming, especially when analyzing large datasets.
Imagine this scenario: you want to find sales above $2,000, identify records between $1,000 and $2,000, and locate branch names that begin with a specific word.
Apply filters over and over again? ❌
Find matching records instantly? ✅
Still doing this manually? Merging tables, comparing lists, cleaning data, and consolidating files can take hours each week. Data Tools Suite automates repetitive tasks in 2 clicks inside Excel—no complex formulas or endless prompts—so you can spend your time analyzing.
TRY IT. YOU'LL GET IT.
🔍 Common situations where specific values matter
High-Value Sales
Identify transactions above a chosen threshold.
Value Ranges
Analyze groups of records within specific boundaries.
Text Searches
Find branch names, codes or records matching text patterns.
Segmentation
Create targeted subsets of data for analysis and reporting.
⚡ Find exactly the data you need
The Select and Filter Cells application allows you to locate records that meet numeric or text-based criteria anywhere in a worksheet, range or table.
You can search for values greater than or less than a specific number, values between two limits, or text that begins with a chosen word or phrase.
Combined with filtering, row selection and marking options, these searches become powerful data analysis tools.
🔴 Traditional Approach
- Apply multiple filters.
- Change criteria repeatedly.
- Review results manually.
- Create temporary subsets.
- Repeat the process.
🟢 With Select and Filter Cells
- Choose a criterion.
- Find matching records instantly.
- Mark or filter the results.
- Analyze data more efficiently.
📝 Example: Finding sales and branches matching specific criteria
The same worksheet can be analyzed from different perspectives. Sometimes you need high-value sales, sometimes records within a range, and sometimes text values matching a given pattern.
These criteria can be applied to figures, codes, names, dates and many other types of Excel data.
💡 Note: This example intentionally combines different search scenarios within a single worksheet to demonstrate the versatility of the tool. If your real data looks like this, you are definitely getting your money's worth. 😄
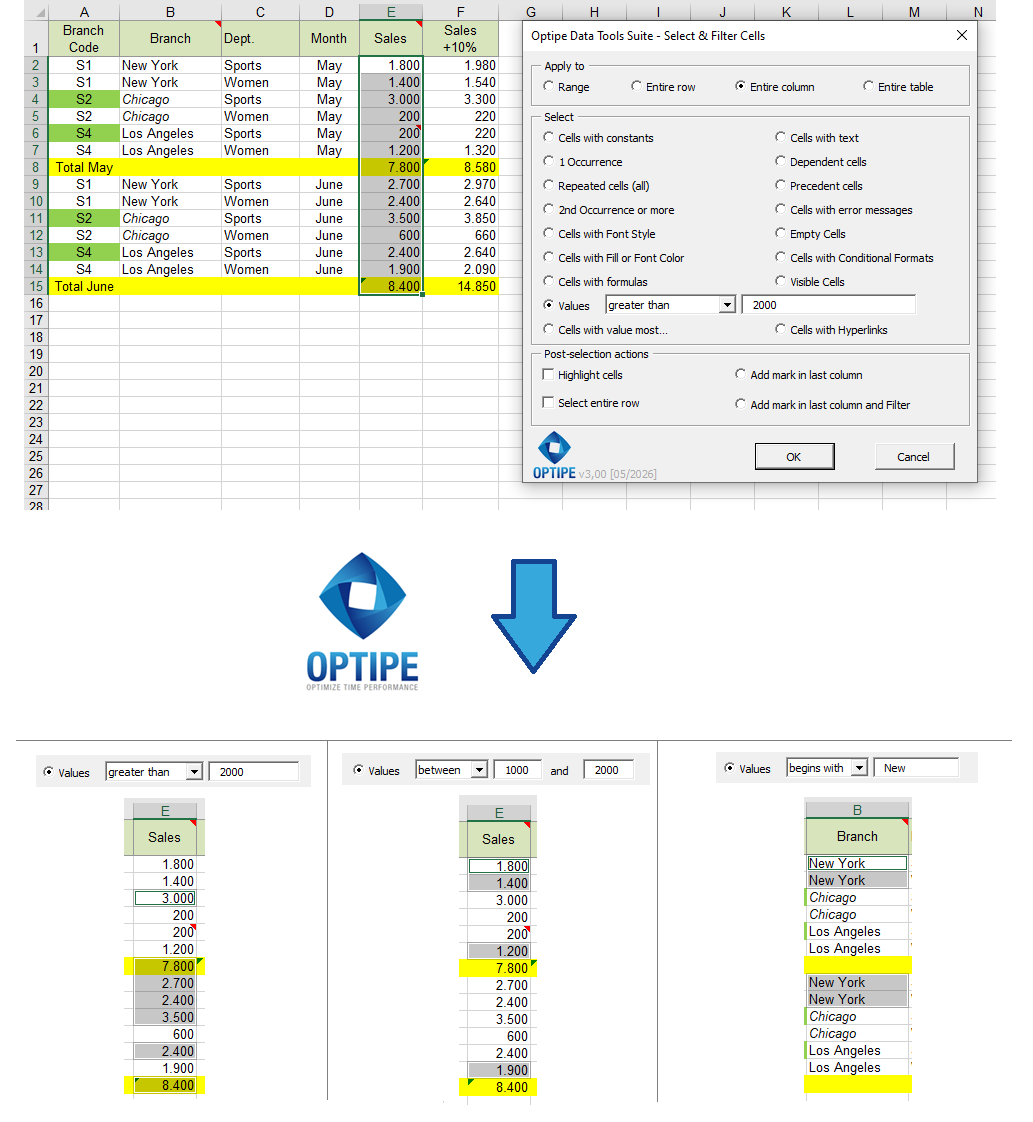
The same worksheet can be used to locate high-value transactions, specific ranges and text-based records.
💡 Result
Records matching each criterion become immediately available for analysis, reporting and decision-making.
💡 Work with complete records: Enable "Select entire row" to copy, move or delete complete rows associated with the records found.
💡 Classify results: Use "Add mark in last column" to build groups and categories inside the same worksheet.
🚀 Much more than searching for numbers or text
Select and Filter Cells helps you isolate the exact records you need for analysis, segmentation and reporting.
- ✔ Find values greater than or less than a selected threshold.
- ✔ Select records between two specified limits.
- ✔ Locate text values that begin with a specific word.
- ✔ Highlight matching records.
- ✔ Filter results automatically.
- ✔ Create segmented datasets for analysis.
🎥 Videos: Finding Specific Values in Excel
Learn how to locate records using numeric and text-based criteria without changing the structure of your worksheet.
Select values matching specific criteria:
Copy rows containing the lowest values:
Filter matching values automatically:
📌 Practical Business Applications
📈 Sales Analysis
Identify high-value transactions, exceptional sales or records that exceed business targets.
📦 Inventory Management
Locate products above, below or within specific stock levels.
🏢 Branches and Customers
Find names, codes and records matching specific text criteria.
📊 Data Segmentation
Create focused datasets for reporting, auditing and operational decision-making.
💡 Practical Segmentation Techniques
The real value of conditional searches is not only finding the records, but also working with them immediately afterwards.
- Add mark in last column: classify multiple groups within the same table.
- Add mark in last column and Filter: display only the matching records.
- Select entire row: copy, move or remove complete records.
- Highlight cells: review matching results visually.
📋 Example: Classifying Data into Multiple Groups
Many analyses require dividing information into categories. For example, high-value sales, medium-range transactions and records that match a specific branch name.
Using the "Add mark in last column" option allows multiple searches to be combined into a single classification system.
💡 Tip: Run multiple searches sequentially and assign different marks to each group. This creates instant segmentation without formulas or helper columns.
⏱ Comparison: Excel Filters vs. Select and Filter Cells
| Traditional Filtering | Select and Filter Cells |
|---|---|
| Apply multiple filters repeatedly. | Select matching records immediately. |
| Review results manually. | Work directly with the matching records. |
| Create temporary subsets. | Copy or filter subsets instantly. |
| Time-consuming for repeated analysis. | Fast and repeatable segmentation process. |
❓ Frequently Asked Questions
Can I search for values greater than a specific amount?
Yes. The application supports greater than, less than, equal to and range-based criteria.
Can I find records between two values?
Yes. You can define minimum and maximum limits to locate records inside any range.
Does it work with text values?
Yes. Text criteria such as begins with, contains and similar searches are supported.
Can I filter only the matching records?
Yes. Use “Add mark in last column and Filter” to display only the selected records.
Can I classify different groups in the same worksheet?
Yes. Automatic marks can be used to build categories and segments.
Does the tool modify my data?
No. It identifies and selects records. Any action remains under your control.
📚 Related Articles
Automate your Excel work and save hours every week
Data Tools Suite includes 18 applications to automate data management, tables and worksheets in Excel.
MultiMail lets you send personalized emails, documents and reports directly from Excel.
TRY IT. YOU'LL GET IT.
🚀 Download Freemium Version