Colors and formatting often contain valuable information. Many Excel workbooks use colors, bold text, italic formatting or conditional formatting rules to highlight records that require attention, follow-up or review.
The challenge begins when you need to work with those records. Manually locating every highlighted cell, colored row or specially formatted value can become extremely time-consuming.
Imagine this situation: you receive a spreadsheet where different users have highlighted important records using colors and formatting. You now need to review, copy, filter or export only those highlighted entries.
Search visually through every highlighted cell? ❌
Select all highlighted records instantly? ✅
Still doing this manually? Merging tables, comparing lists, cleaning data, and consolidating files can take hours each week. Data Tools Suite automates repetitive tasks in 2 clicks inside Excel—no complex formulas or endless prompts—so you can spend your time analyzing.
TRY IT. YOU'LL GET IT.
🎯 Examples where formatting becomes useful information
Pending Tasks
Records marked for future follow-up.
Exceptions
Items requiring correction or review.
Approved Records
Validated or completed information.
Conditional Formatting
Special values highlighted automatically by Excel.
⚡ Turn colors and formatting into useful data filters
The Select and Filter Cells application allows you to locate records based on fill color, font color, text styles and formatting rules.
Instead of treating colors as a visual aid only, you can transform them into actionable data groups for reporting, exports and analysis.
🔴 Traditional Approach
- Scan the worksheet visually.
- Copy records manually.
- Build temporary filters.
- Review data row by row.
🟢 With Select and Filter Cells
- Select by color or style.
- Work with complete records.
- Filter matching rows instantly.
- Create focused data subsets.
📝 Example: Working with visually highlighted records
Many organizations use formatting conventions to communicate information. Colors, text styles and conditional formatting often indicate status, priority or exceptions.
This tool allows those visual signals to become searchable and actionable records.
💡 Note: This example intentionally includes several colors and formatting styles to demonstrate the capabilities of the tool. In real-world worksheets, formatting is usually applied more consistently.
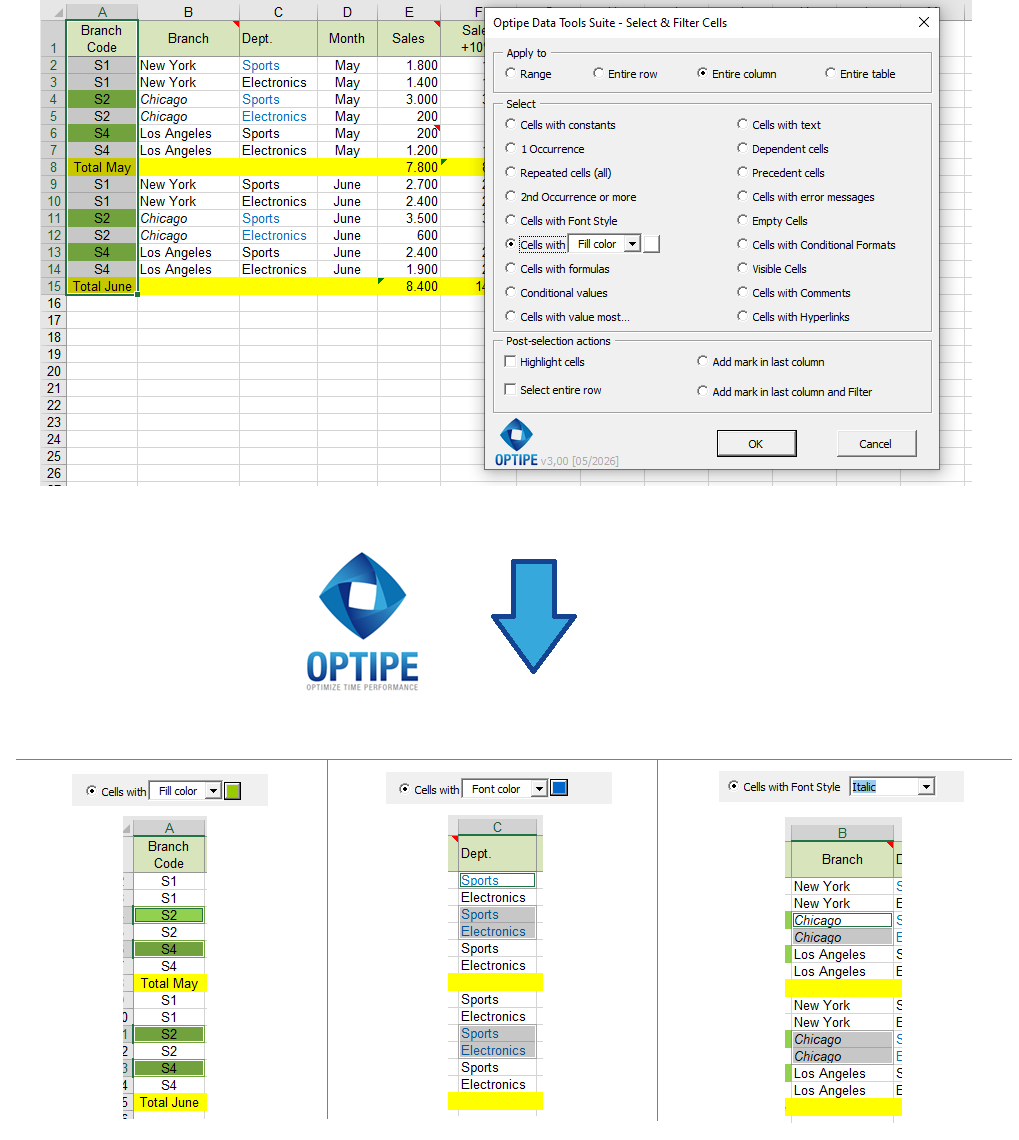
Colors and formatting can quickly become powerful data subsets for review, analysis and reporting.
💡 Result
Visually highlighted records become instantly available for filtering, copying and further analysis.
💡 Work with complete records: Enable "Select entire row" to copy, move or delete complete rows associated with the records found.
🚀 Formatting can become actionable data
Colors, styles and formatting are often used to communicate priorities, statuses and exceptions. This tool allows you to work with them directly.
- ✔ Select by fill color.
- ✔ Select by font color.
- ✔ Find bold or italic text.
- ✔ Work with conditional formatting results.
- ✔ Copy or filter highlighted records.
- ✔ Create focused datasets based on visual criteria.
🎥 Video: Select Records by Color and Formatting
Learn how to locate rows based on fill color, font color and text styles.
Copy rows by fill color, font color or style:
📌 Practical Use Cases
📋 Task Tracking
Automatically select pending, urgent or follow-up records highlighted by team members.
📊 Audits and Reviews
Work only with items previously highlighted during review processes.
✅ Approval Workflows
Locate approved, rejected or validated records using color-coded systems.
🚨 Exceptions and Alerts
Analyze values highlighted by conditional formatting rules.
💡 Practical Techniques for Visual Data Management
Although this feature is more specialized, it can save significant time when formatting carries operational meaning.
- Select entire row: copy, move or export complete highlighted records.
- Add mark in last column and Filter: display only matching records.
- Combine multiple criteria: analyze different highlighted groups separately.
- Review conditional formatting results: focus only on exceptions and outliers.
📋 Example: Create a List of Pending Records
Many spreadsheets use colors and formatting to indicate status. Manually finding those records becomes increasingly difficult as the table grows.
Selecting records by color transforms visual signals into searchable data groups.
💡 Tip: This feature is especially useful when multiple users collaborate in the same workbook and use colors to indicate actions, priorities or review status.
⏱ Comparison: Visual Review vs. Select and Filter Cells
| Visual Review | Select and Filter Cells |
|---|---|
| Search colors manually. | Select matching records automatically. |
| Review the entire worksheet. | Focus only on relevant records. |
| Copy rows one at a time. | Work with complete records instantly. |
| Slow and repetitive. | Fast and repeatable workflow. |
❓ Frequently Asked Questions
Can I select cells by fill color?
Yes. The application can automatically locate cells sharing the same background color.
Does it work with font colors?
Yes. Font color can be used as a search criterion.
Can I search for bold or italic text?
Yes. Text styles can be used as selection criteria.
Can I work with conditional formatting?
Yes. Highlighted values created by conditional formatting rules can be selected.
Can I copy only the highlighted rows?
Yes. Use "Select entire row" to copy or move matching records.
Does the tool change formatting?
No. It uses existing formatting only as a search condition.
📚 Related Articles
Automate your Excel work and save hours every week
Data Tools Suite includes 18 applications to automate data management, tables and worksheets in Excel.
MultiMail lets you send personalized emails, documents and reports directly from Excel.
TRY IT. YOU'LL GET IT.
🚀 Download Freemium Version